Category:
Data Visualization

Introduction
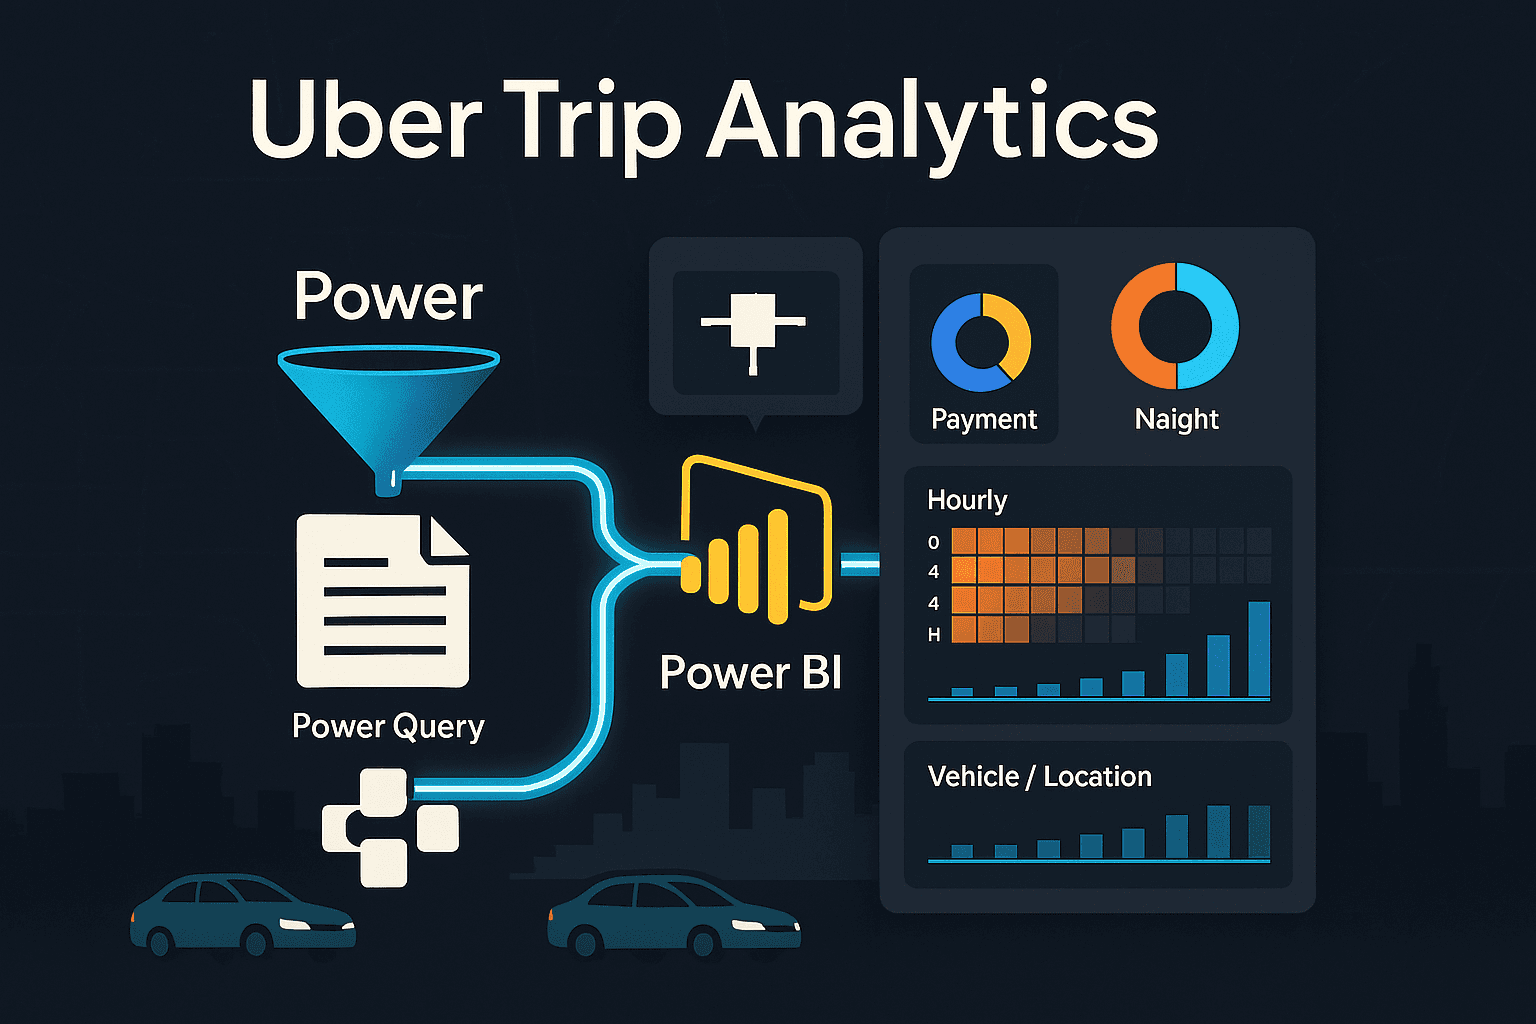
This project delivers a comprehensive Uber Trip Analytics solution, transforming raw trip logs into an interactive Power BI platform that uncovers demand patterns and drives operational decisions. By cleaning millions of ride records, modeling a star schema, and building dynamic dashboards with enterprise-grade automation and monitoring stakeholders gain on-demand insights into bookings, revenue, and peak utilization windows.
Process
Data Collection and Cleaning
• Ingested raw Uber trip logs and applied Power Query transformations to standardize fields, handle missing timestamps, and filter out incomplete records establishing a reliable dataset for modeling.Exploratory Data Analysis & Structuring
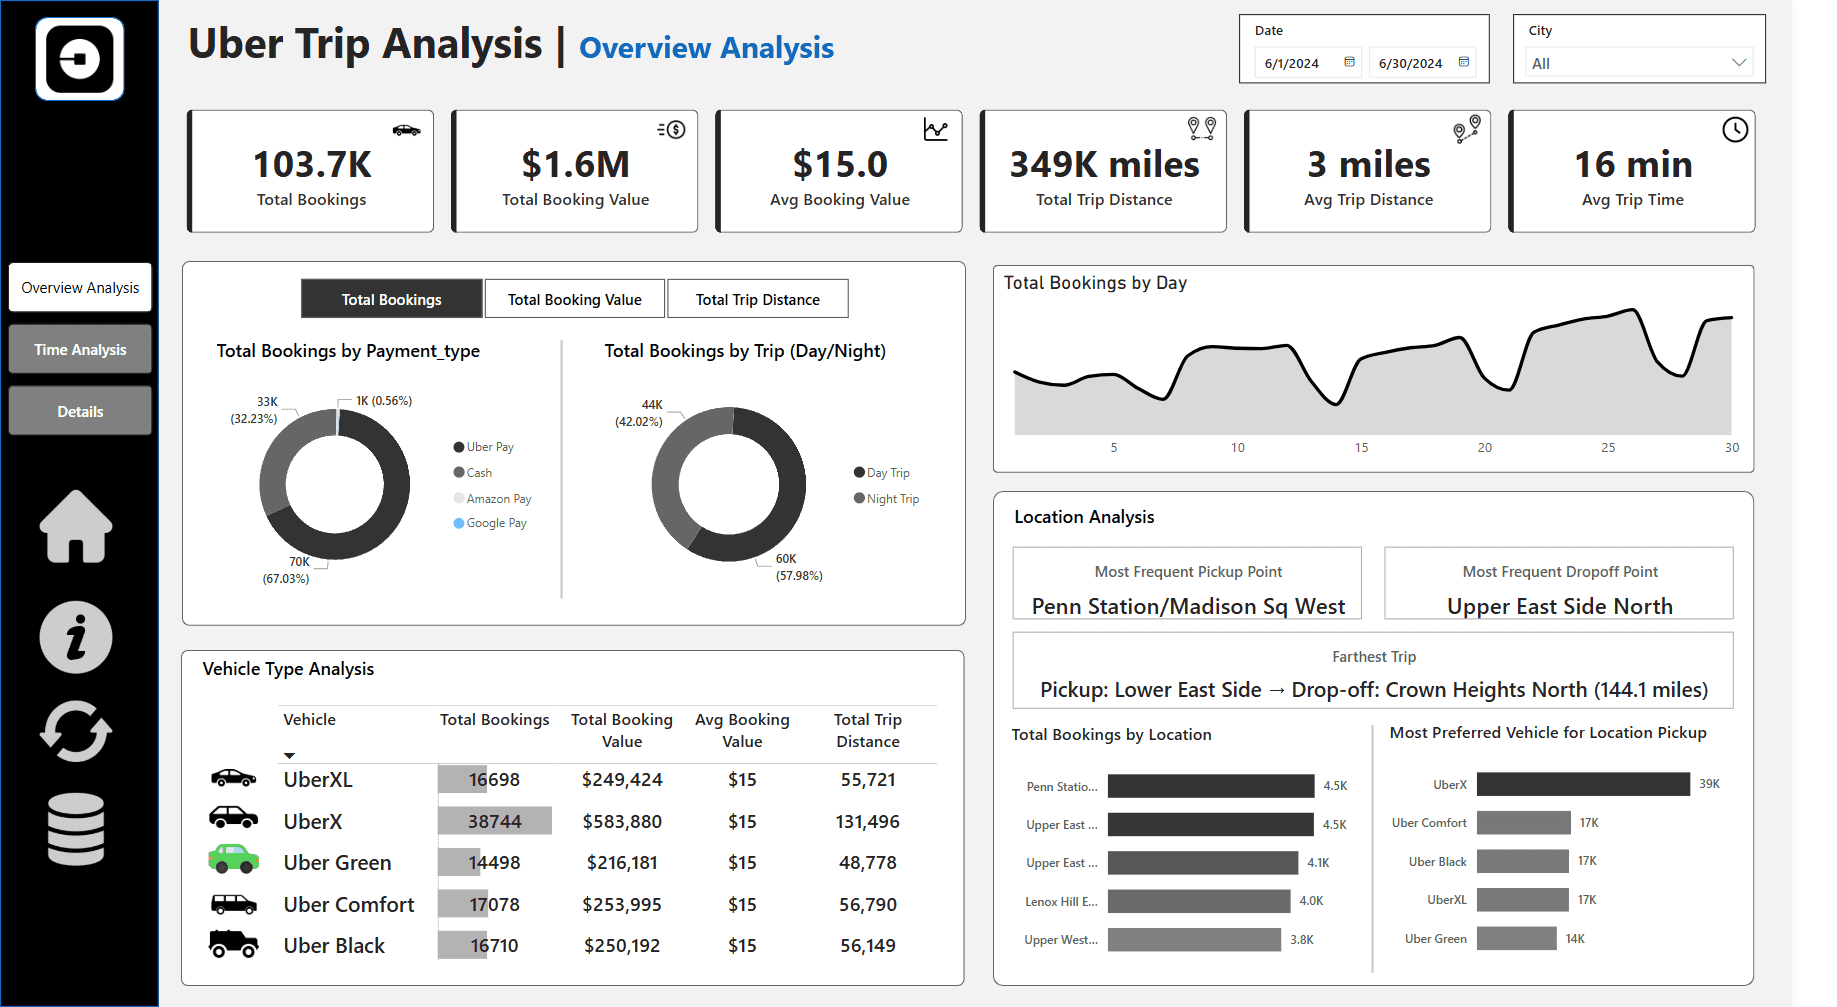
• Designed a star schema in Power BI, with fact tables for trip events and dimension tables for dates, cities, and vehicle types.
• Authored DAX measures (Total Bookings, Booking Value, Avg Distance, Avg Duration) and parameter-driven slicers for Date and City to enable flexible, on-the-fly analysis.ETL Orchestration & BI Integration
• Configured Power BI dataflows to automate the extract-transform-load process from Power Query into the star schema.
• Developed interactive reports featuring KPI cards, payment-type & day/night donut charts, an hourly heat map, and vehicle/location bar charts highlighting demand peaks and revenue drivers.Validation & Iteration
• Compared key metrics in Power BI against source trip logs to validate accuracy after each refresh.
• Gathered feedback from operations and finance teams to refine visualizations, add new filters (e.g., payment type segmentation), and improve dashboard usability.
Outcome
Actionable Insights: Surfaced peak demand windows by hour, city, and vehicle type enabling data-driven fleet reallocation.
Revenue Uplift: Achieved measurable uplift by shifting under utilized vehicle types into identified peak windows.
Operational Efficiency: Reduced manual report generation by 80%, empowering stakeholders with real-time, self-service analytics.