Category:
Data Visualization
Introduction
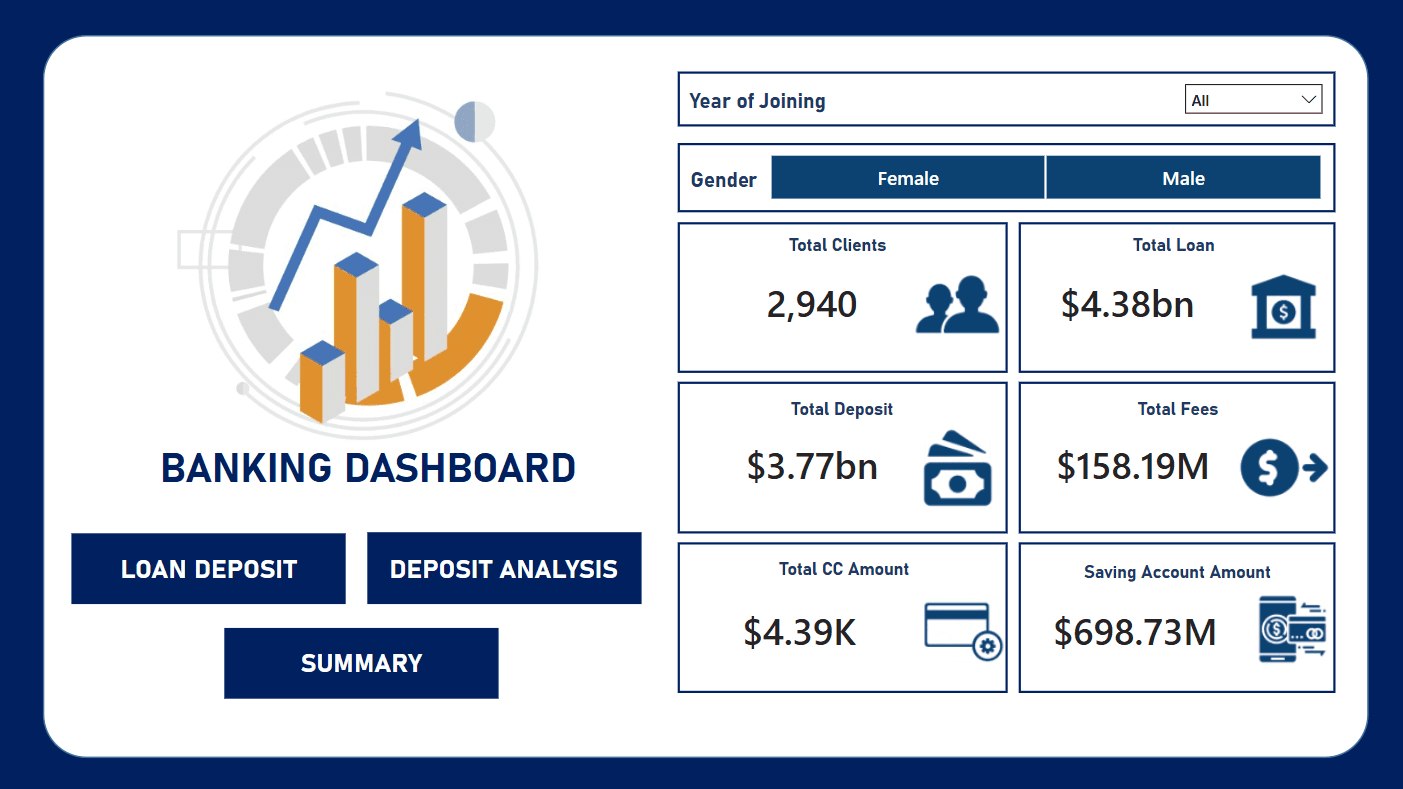
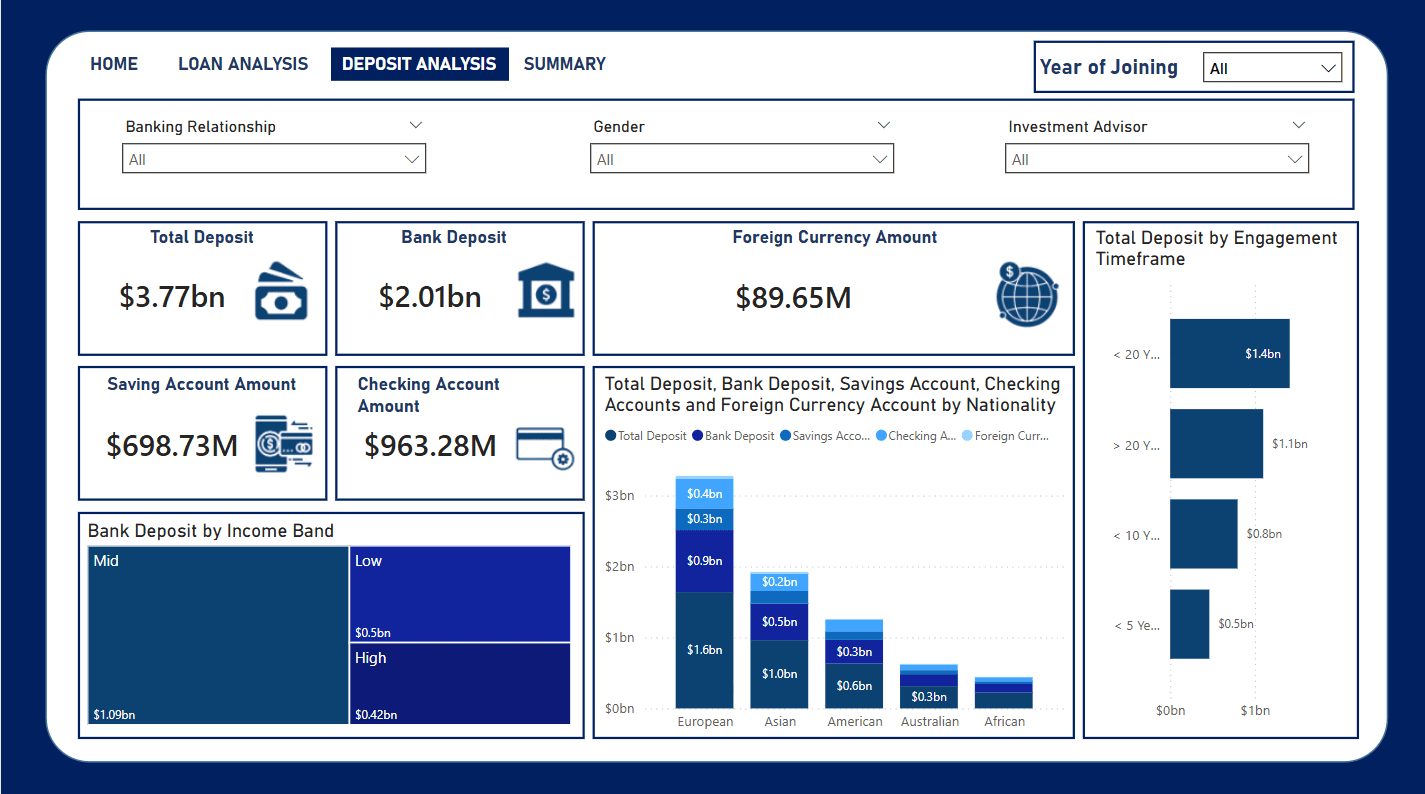
This project delivers a Banking Risk Analysis Dashboard that consolidates disparate financial sources into a unified Power BI platform, enabling rapid risk assessment and capital reallocation. By integrating general ledger, loan, deposit, and fee data into a star schema, and layering on interactive analytics, stakeholders gain real-time visibility into client exposures and revenue drivers all backed by automated refreshes and variance alerts for enterprise reliability.
Process
Data Collection and Cleaning
• Ingested GL, loan, deposit, and fee datasets from multiple source systems.
• Applied Power Query transformations to standardize account codes, normalize transaction dates, and purge erroneous or duplicate records establishing a single, cleansed data foundation.Exploratory Data Analysis & Structuring
• Profiled key measures (e.g., total exposures, fee income) to identify outliers and seasonal patterns.
• Designed a Power BI star schema: a central fact table for transactions, with dimension tables for Clients, Products, Time (Year/Quarter), Relationship Type, Gender, and Advisor.ETL Orchestration & BI Integration
• Built Power BI dataflows to automate the extract–transform–load process from Power Query into the star schema.
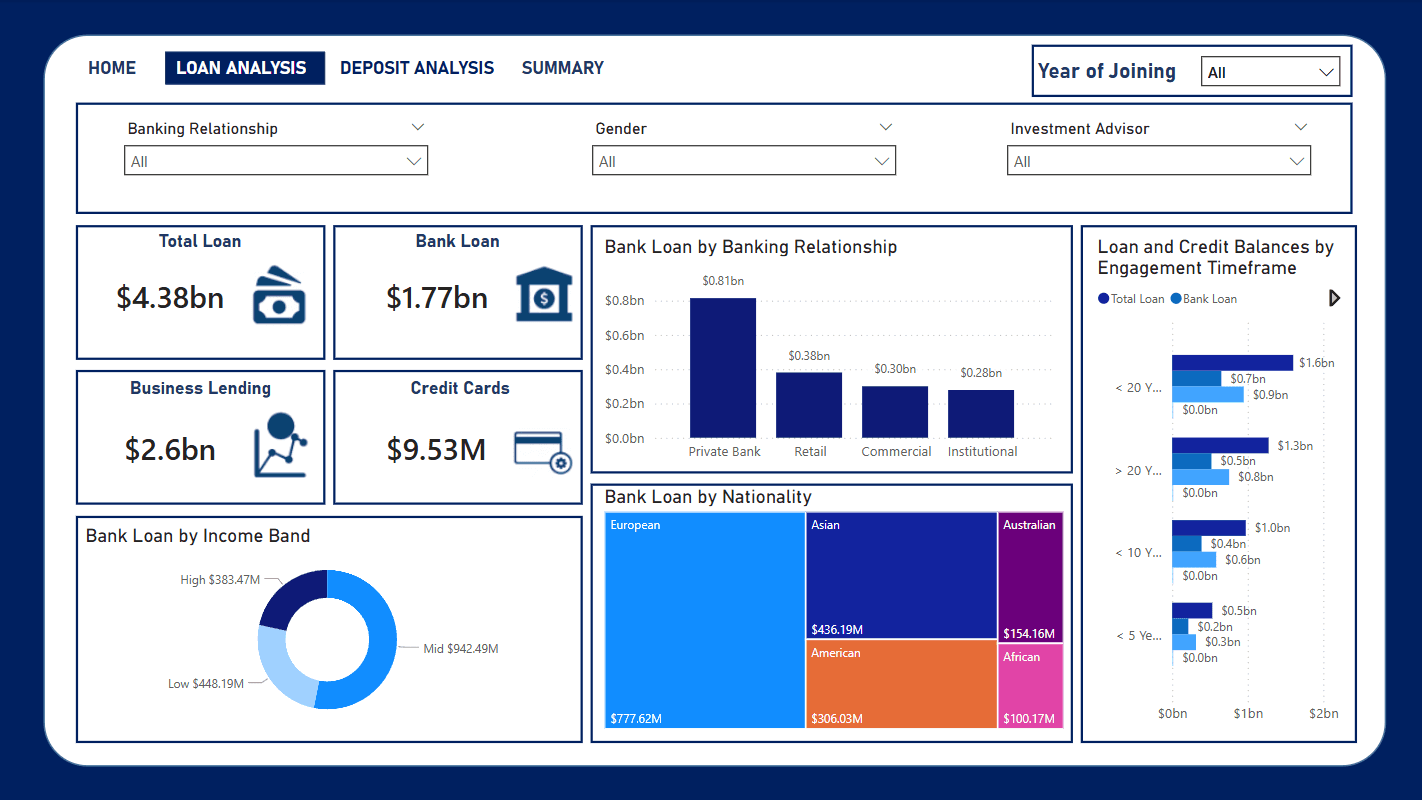
• Authored DAX measures for Clients, Loans Outstanding, Total Deposits, and Fee Income, and configured slicers for Year, Relationship, Gender, and Advisor to support multi-angle analysis.Validation & Iteration
• Cross-validated Power BI metrics against source system reports each cycle to ensure data integrity.
• Solicited feedback from risk managers and finance partners to refine visualizations, add new filters (e.g., client segment), and improve dashboard performance.
Outcome
Actionable Insights: Delivered drill-down views of high-exposure clients and fee-income trends, guiding targeted risk mitigation and product recommendations.
Efficiency Gains: Accelerated monthly risk reporting by 60%, from manual consolidation to an automated, self-service dashboard.
Scalable, Self-Service Analytics: Empowered advisory and treasury teams to explore risk drivers on demand reducing decision latency and supporting proactive capital reallocation.